Stop trading
against the trend.
Most losing trades have one thing in common: they fight the trend. Anchor makes the trend impossible to miss. Your chart turns green or red, with one BUY when a trend starts and one SELL when it ends. Check it before every trade. It takes five seconds.
Simulated price data showing how Anchor looks on a chart. Hover it.
Sound familiar?
The expensive mistakes
every trader makes
None of these is bad luck. They all come from the same blind spot: not knowing which way the market is really going.
You bought the breakout…
…and it turned out to be the top. The trend had already rolled over, and the chart didn't make it obvious.
You shorted the 'overbought' coin…
…and it kept ripping for weeks. Overbought can stay overbought in a strong trend.
You have 6 indicators on your chart…
…and they disagree. RSI says sell, MACD says buy, and you freeze or guess.
You sold too early…
…out of nerves, then watched the trend run without you, because nothing told you it was still intact.
See the difference
Same chart. One answer.
Drag the handle. On the left you’re guessing. On the right you see the direction instantly.
Simulated price data for illustration.
Real charts
Out before the drop. In for the move.
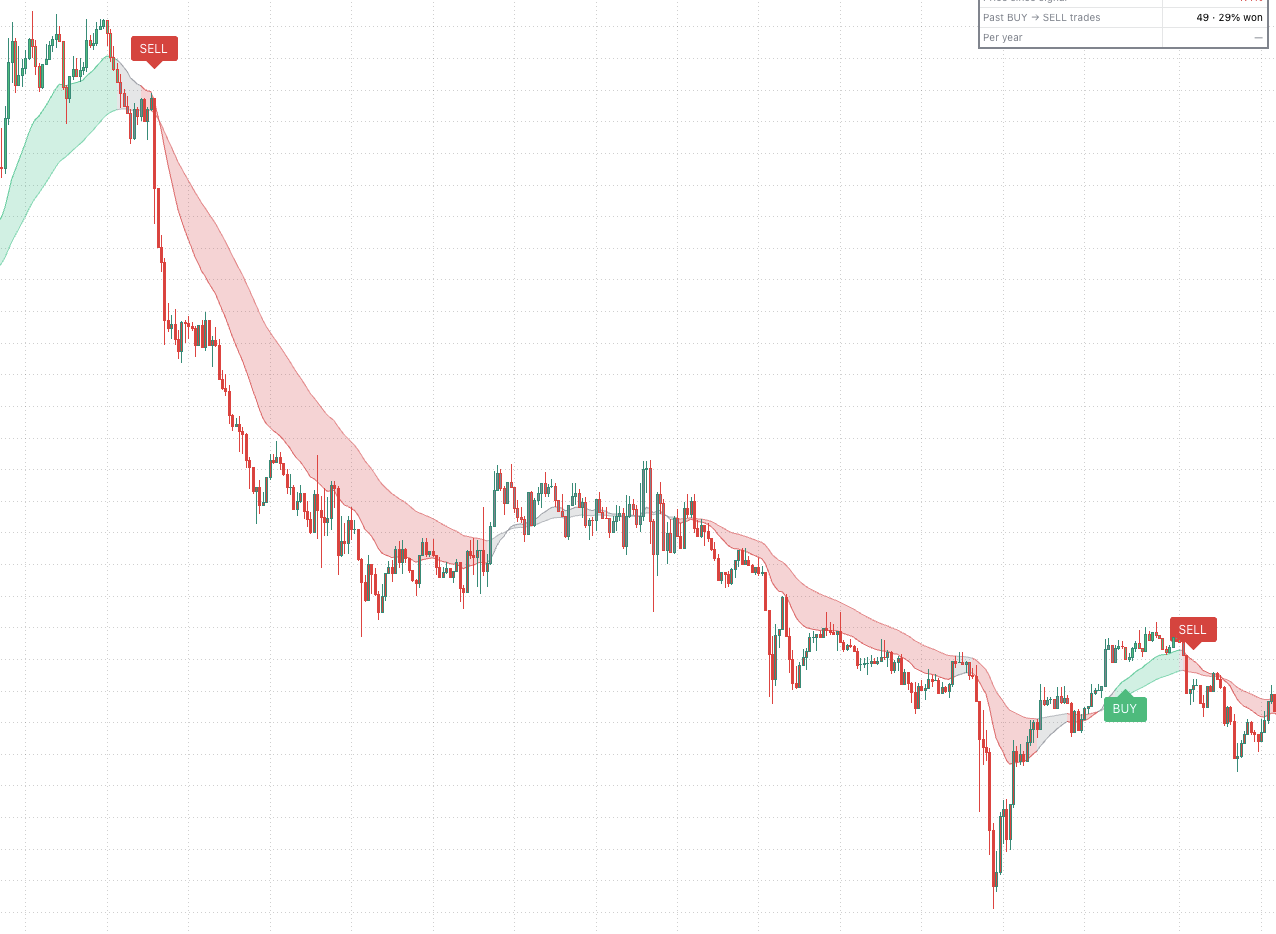
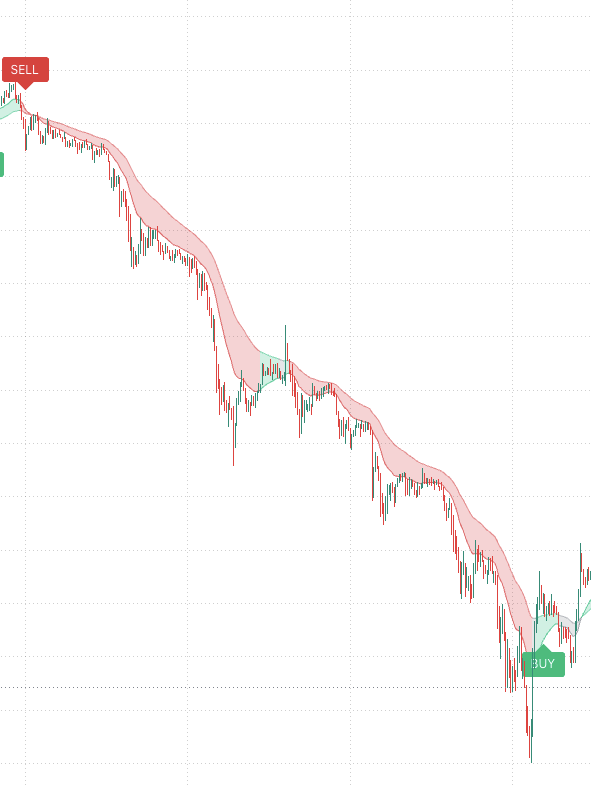
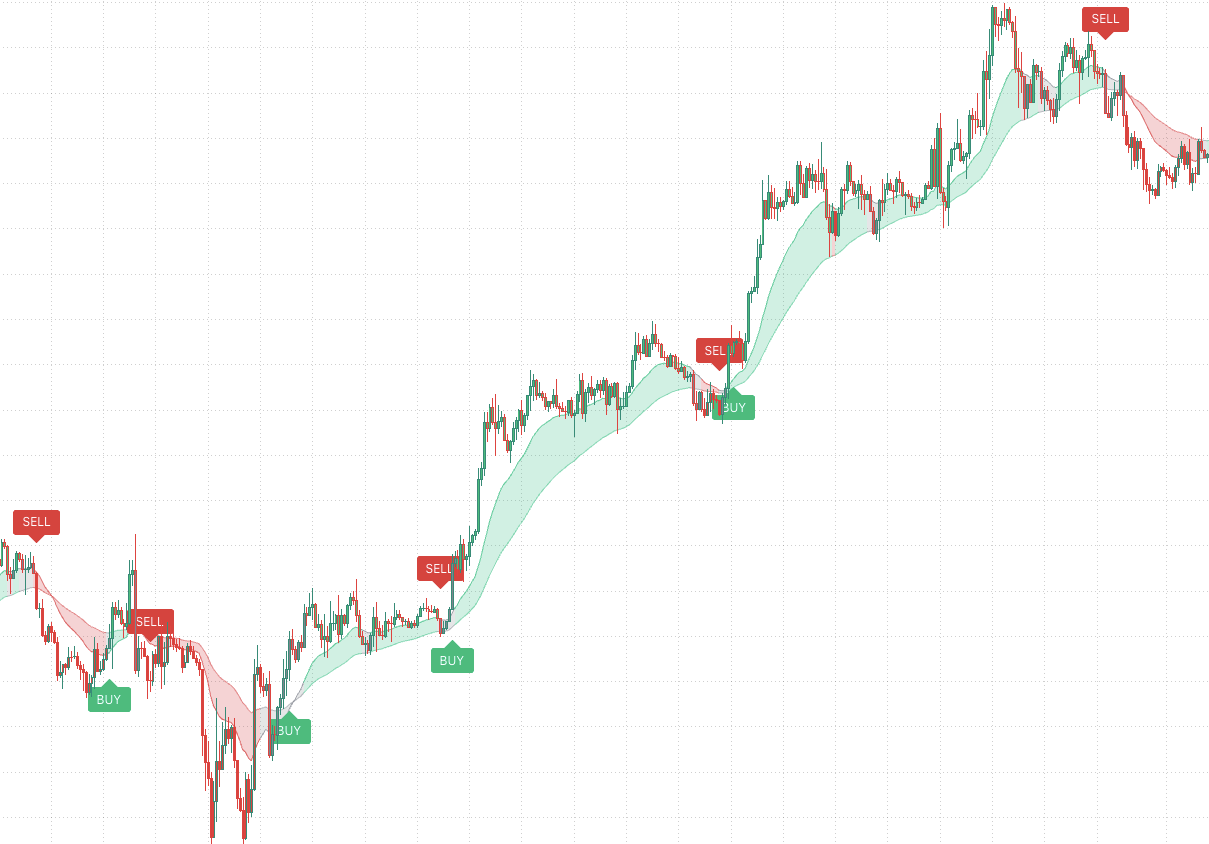
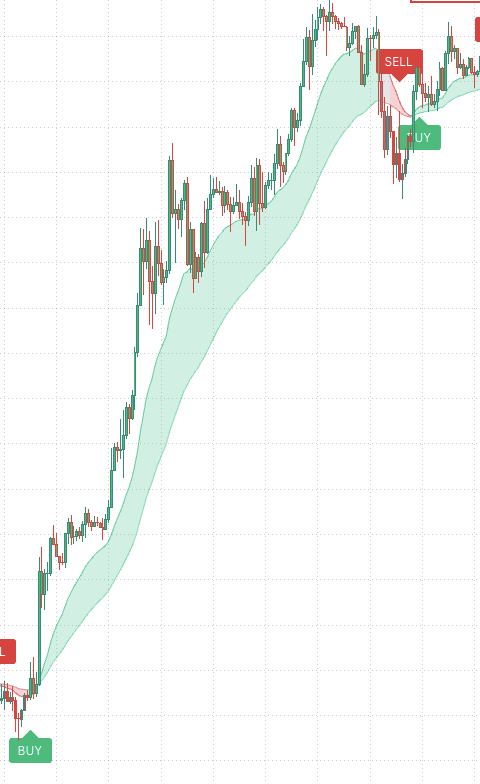
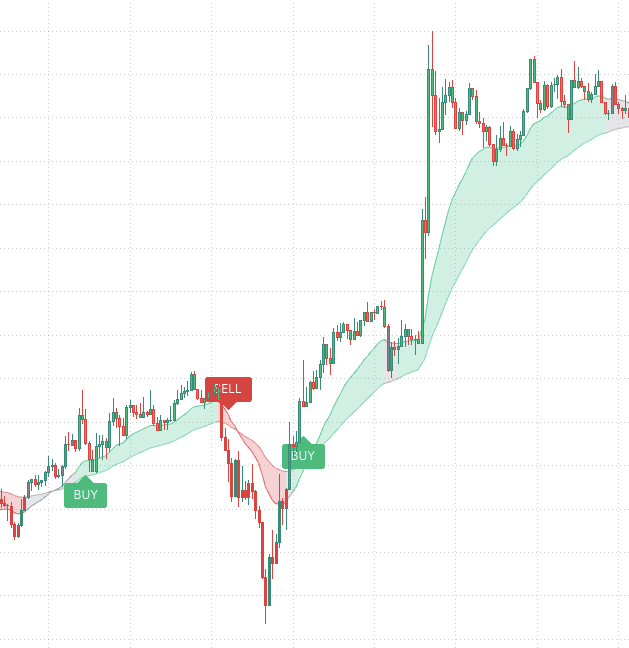
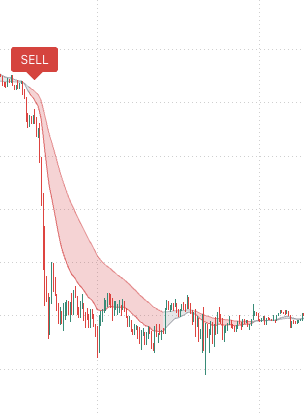
Actual TradingView screenshots with Anchor on the chart. One SELL, one BUY, and the trend in between.
Put Anchor on your own chart.
Same colours, same signals, on any coin you trade. On your TradingView within 24 hours.
Get AnchorScreenshots from real TradingView charts with Anchor. Selected examples. Not every trend is this clean, and trend following has losing trades too. Some screenshots are from earlier versions and show small extra signals inside big trends; the current version filters most of these out. See the full results.
Your new habit
The 5-second check before every trade
Professional traders don't trade against the trend. Now you don't have to either.
Open your chart
Any coin, on Daily, 4H or 15m. Anchor is already on it.
Look at the colour
Green: the trend is up. Red: it's down. Grey: no clear trend, so be careful.
Trade with it, or don't
Planning a long in a red market? That's your warning. Wait for green, or skip the trade.
Under the hood
Four engines.
One colour.
Most trend tools are one moving average. Anchor asks four independent engines and only paints a trend when they agree.
Trend
EMA 9/20/50/100/200 order and slope, plus higher highs and lows (or lower) from confirmed swing points, Break of Structure and Change of Character.
Momentum
Blended into one vote because they move together. Your Smooth Stoch RSI (21/21/5/5) is part of it. Counting them separately would be fake confirmation.
Volume
Is the move backed by real trading? Price vs VWAP, estimated buying vs selling pressure and the OBV trend. Relative volume is shown separately in the dashboard.
Strength
A trend only counts when it has strength. ADX must be 20 or higher, and +DI vs −DI gives the direction. Weak, choppy markets stay grey.
Build it up
From noise to one decision
Click through each step and watch a messy chart become green, red and two simple signals.
Simple by design
How a signal plays out
One BUY, one SELL, and silence in between. That’s the whole system.
Make it yours
Calm, balanced or aggressive
Pick a signal style in one click, or fine-tune every setting yourself. Every option is fully adjustable.
Fewer signals
CalmFor traders who hate noise. Waits for strong, established trends. Almost no flip-flops, but later in and later out.
- Signals per coin
- ~2.5 BUYs a year
- Flip-flops
- 3–4%
- Per year, full / unseen
- +29% / +12%
- Worst drop, unseen
- −29%
Balanced
RecommendedThe default and best all-rounder. It detects your timeframe and switches to settings tuned for Daily, 4H or 15-minute charts automatically.
- Signals per coin
- ~3.3 BUYs a year
- Flip-flops
- 6–7%
- Per year, full / unseen
- +48% / +17%
- Worst drop, unseen
- −32%
Earlier signals
AggressiveGets in closest to tops and bottoms, at the price of many more false starts. Only if you're happy to be wrong more often.
- Signals per coin
- ~5 BUYs a year
- Flip-flops
- 21–24%
- Per year, full / unseen
- +42% / +3%
- Worst drop, unseen
- −48%
Everyday settings
- Signal style · Balanced, Fewer signals, Earlier signals or Custom. One click.
- Candle colours · Green / red / grey candles on or off.
- Trend cloud · The coloured band behind price, on or off.
- 200-day average · The classic 200-day line as a dotted marine-blue line, shown on every timeframe (even 4H and 15m), on or off. A reference only; it doesn't change the signals.
- Dashboard · On or off, plus optional engine details (each engine's vote).
Advanced (Custom style)
- Trend starts at score · Higher means stricter, fewer trends.
- Minimum ADX · How strong a move must be to count as a trend.
- Swing length · How big a swing must be for structure breaks.
- Early signals · Fire on structure breaks, or only on confirmed trends.
- Trend must hold N bars · More bars, fewer flip-flops.
- Clear the slow line by × ATR · Keeps signals out of the cloud and away from dips.
Open the settings by double-clicking ANCHOR on your chart. The dashboard’s results update instantly, so you can see how any change performed on your coin. Preset figures: backtest on the 10 largest coins, Daily chart, long only, before fees (Balanced uses its own tuned settings on 4H and 15m; see the results section); “flip-flops” are signals reversed within 10 bars. All other results on this page use Balanced.
Receipts
Tested, not hyped
Real backtest numbers compared with simply buying and holding, including data it never saw while we tuned it.
BUY → SELL vs buy & hold · top 10 coins · Daily, 4H, 15m
with Anchor
Return per year
Worst drop · 44% smaller
with Anchor
Return per year
Worst drop · 28% smaller
with Anchor
Return per year
Worst drop · 39% smaller
| Daily chart, per year | BTC | ETH | XRP | BNB | SOL | DOGE | TRX | ADA | AVAX | LINK |
|---|---|---|---|---|---|---|---|---|---|---|
| Anchor | +43% | +49% | +7% | +89% | +74% | +111% | +23% | +41% | +12% | +30% |
| Hold | +26% | +13% | +13% | +55% | +32% | +60% | +39% | +9% | -22% | +21% |
Method: the 10 largest non-stablecoin cryptocurrencies (BTC, ETH, XRP, BNB, SOL, DOGE, TRX, ADA, AVAX, LINK) on Binance spot. Daily data from 2017–2020 depending on the coin, 4H from 2021, 15-minute from June 2025, all to Nov 2026. Each timeframe uses its auto-tuned Balanced settings. Signals use the shipped rules (early structure-break signals plus confirmed-trend signals). Long only: buy at the close of each BUY bar, sell at the close of the next SELL bar, fully invested, before trading fees and slippage. With about 3 trades a year per coin on Daily, a typical 0.1% fee costs well under 1% a year. Results are averaged across coins; buy & hold covers the same period. “Unseen data” is the final 30% of each coin, held out while choosing settings, and it was a weak period for most coins. Shorting on SELL was tested and lost money on unseen data. Past results do not guarantee future returns.
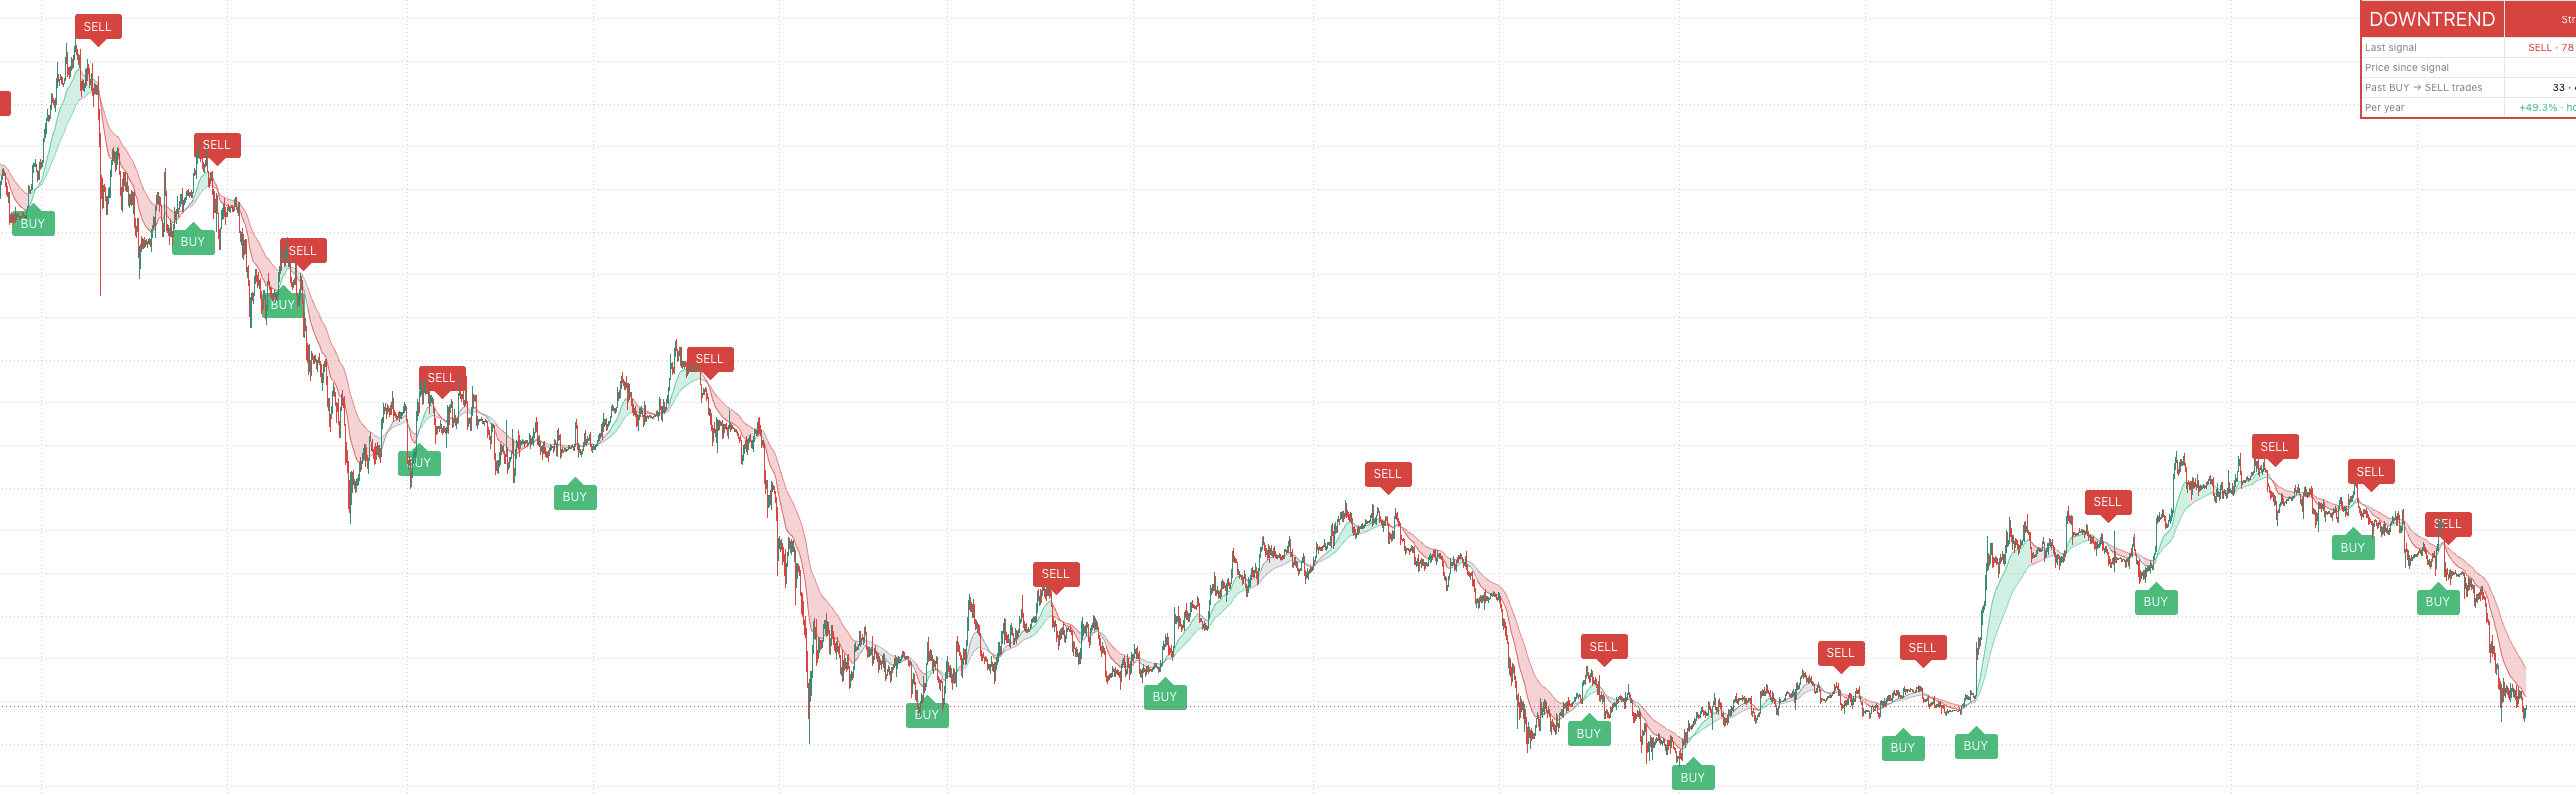
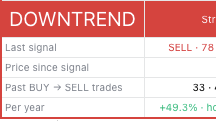
Example of the dashboard. The trade figures are BTC Daily from the backtest above (2017–2026); the last-signal rows are illustrative. On your chart, the dashboard recalculates for whatever coin you open.
Play with it
Win rate isn't the whole story
Trend following wins less than half the time and still comes out ahead, because the winners are much bigger than the losers. Drag the sliders and see why.
*One simulated sequence of 100 trades, compounding. Win rate alone means nothing. What matters is win rate × size of winners. That’s why the indicator shows profit factor and R next to win rate. Illustration only.
Pricing
Pick your plan
Instant access after checkout. Cancel renewal anytime. All sales final.
Monthly
Full access, cancel anytime.
About $1.63 a day
Get Monthly- Anchor on your TradingView account (invite-only)
- Green / red / grey trend colouring: direction at a glance
- One BUY when an uptrend starts, one SELL when it ends
- Four-engine trend score: trend, momentum, volume, strength
- Non-repainting: confirmed on bar close
- 3 one-click signal styles + fully adjustable settings
Yearly
Two swing seasons for less than eight months.
Just $1.09 a day
Get Yearly- Anchor on your TradingView account (invite-only)
- Green / red / grey trend colouring: direction at a glance
- One BUY when an uptrend starts, one SELL when it ends
- Four-engine trend score: trend, momentum, volume, strength
- Non-repainting: confirmed on bar close
- 3 one-click signal styles + fully adjustable settings
- Alerts for every BUY and SELL
- Dashboard with the record vs buy & hold
- Setup guide
- All future updates
Lifetime
Pay once. Every future update included.
One payment, yours for good
Get Lifetime- Anchor on your TradingView account (invite-only)
- Green / red / grey trend colouring: direction at a glance
- One BUY when an uptrend starts, one SELL when it ends
- Four-engine trend score: trend, momentum, volume, strength
- Non-repainting: confirmed on bar close
- 3 one-click signal styles + fully adjustable settings
FAQ
Questions
Green candles mean uptrend, red mean downtrend, grey means no clear trend. You get one BUY when an uptrend starts and one SELL when a downtrend starts. No repeats in between. That's it.
No. Signals and colours are confirmed when the bar closes, and swing points are only used once they're confirmed. What you see in history is what you would have seen live.
Because nobody can know a bottom is the bottom until price has turned. Indicators that show perfect bottoms and tops on old charts move their signals back in time after the fact (they repaint). Anchor fires as soon as market structure flips, which gets you in early in the move, and it never changes a signal afterwards.
Daily, 4H and 15-minute charts. The default Balanced style detects your timeframe and switches to settings tuned for it. It was tuned on the 10 largest coins (BTC, ETH, XRP, BNB, SOL, DOGE, TRX, ADA, AVAX, LINK). Daily gave the strongest results; 4H beat buy-and-hold on most coins; 15m stayed ahead of holding too, but it trades often, so fees matter a lot there. It runs on any TradingView chart.
Anchor is trend following, tuned on the 10 largest cryptocurrencies. In our Daily backtest (long only: buy on BUY, step aside on SELL, before fees) it won about 40% of trades, was profitable on all 10 coins over the full history and beat buy-and-hold on 8 of them: about +48% a year vs +25% on average, and +17% vs −4% on the most recent data it never saw (beating holding on 9 of 10 coins). Drawdowns were still large (around −32% to −49%). Losing streaks are normal. The dashboard shows the real record on your chart.
Because trends that fail are cut quickly with small losses, while trends that run are held until they end. A few big winners pay for many small losers. Chasing a high win rate usually means taking profits too early and missing the big moves.
Yes. Choose a signal style in one click (Balanced, Fewer signals or Earlier signals), or pick Custom and adjust every setting: trend threshold, minimum ADX, swing length, early signals on or off, how many bars a trend must hold, and how far price must clear the slow line. Candle colours, the trend cloud and the dashboard can be switched on or off. The dashboard shows how your settings performed on the chart you're viewing.
We tested it: shorting every SELL lost money on recent data. Treat SELL as "get out and wait" unless you're an experienced short seller.
It works on 15m: the auto-tuned settings stayed well ahead of buy-and-hold in our tests (about +5–6% a year while holding lost 10–31% a year, before fees). But 15m gives around 115 signals a year per coin, and normal 0.1% exchange fees would cost more than that edge. Use it with very low fees, or use the colour as a direction filter for your own entries.
No. It's a disciplined way to follow trends and avoid fighting them. It has drawdowns and losing streaks. Treat any indicator that promises huge returns with suspicion, including us.
Enter your TradingView username in your dashboard (free TradingView accounts work). Anchor is added to your account as an invite-only script, usually within a few hours and always within 24. Then: Indicators → Invite-only scripts → Anchor.
Yes. Set one alert and you'll be notified of every BUY and SELL on that chart.
Anytime, in one click from your dashboard through Stripe's billing portal. You keep access until the end of the period you paid for. Then the indicator is removed from your TradingView account.
No. All sales are final because access to the full indicator starts right away. You can cancel a subscription at any time to stop future renewals. Billing errors are always fixed. See the Refund Policy for details.
The next trend is coming.
Will you be on the right side?
Join today, enter your TradingView username, and Anchor is on your chart within 24 hours. Cancel monthly plans anytime.
Get access